

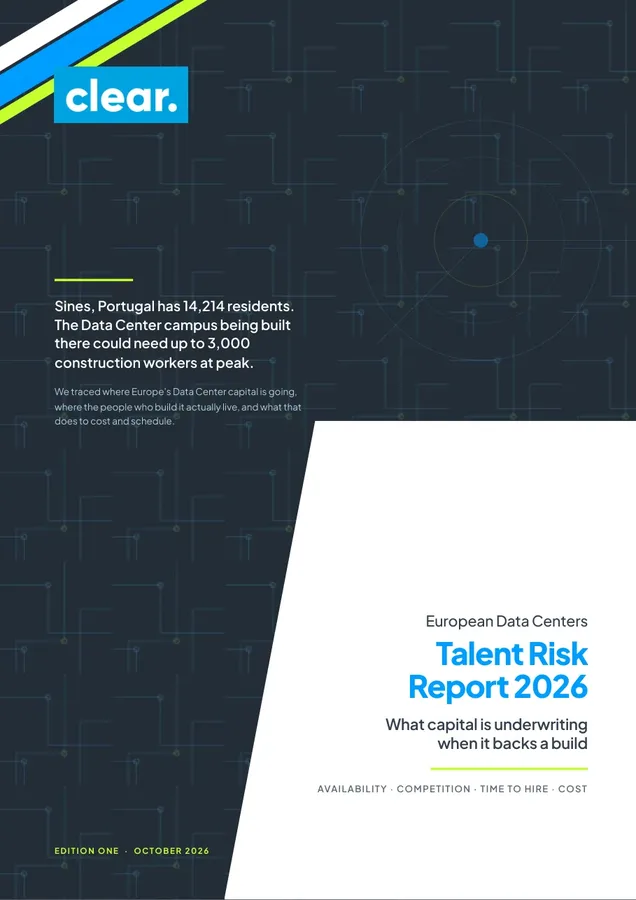
Power decides where a European Data Center gets built. People decide when it opens.
Sines, Portugal has 14,214 residents. The campus being built there could need up to 3,000 construction workers at peak. Our free 16-page report rates talent risk across ten European markets, from 1,896 of our own placements and official data for 16 countries.
In brief
What the report found
National statistics do not show a construction labour crisis in Europe. The squeeze sits in a small specialist layer, and on our records it behaves as one travelling market: a campus near Helsinki and a campus in Sines recruit from the same pool.
- Capital is moving away from the labour
- The five core metros hold 43% of EMEA's operational capacity but only 32% of its pipeline. Hyperscale greenfield sites now sit an average 175 km from a hub city, up from 46 km (JLL, August 2026).
- One workforce, travelling
- 6 in 10 of the people we placed into European roles since January 2024 lived in a different country from the job (118 of 199). In Finland, the Netherlands, Sweden, Norway and Portugal it is 3 in 4.
- The specialist layer costs more
- The median base on our euro-paid placements rose 12.5% in a year, from €80,000 to €90,000, while EU construction wages rose about 4%.
- Hires are taking longer
- Median time from first CV to offer rose from 35 days in 2025 to 49 days in 2026. Hires living in Germany took a median 136 days from first CV to first day.
- Big builds in small labour markets
- Sines, Portugal has 14,214 residents. Its campus could need up to 3,000 construction workers at peak, close to the 3,050 in its whole sub-region. Microsoft's Helsinki build peaks at 7,500, 12% of the region's construction jobs.
- Leadership is the slowest hire
- Director-level placements took a median 103 days from first CV to first day. For a new platform, that is the critical path.
Sources: Clear placement records, January 2021 to 1 October 2026; Eurostat and ONS; JLL, Knight Frank and CBRE capacity data; campus workforce figures as stated by developers. Full source list on page 15 of the report.
The market view
Talent risk across ten European markets
Four questions, asked of each market. Can you find the people, who else wants them, how long does a hire take, and what does it cost? The ratings are our consultants' judgement. The evidence beside each one is measured.
London
- Availability
- High
- Competition
- High
- Time to hire
- Low
- Cost
- High
Pipeline 3.9x live. 54 days from CV to start (248). Construction jobs flat since 2021 while all London jobs rose 8.0%.
Dublin
- Availability
- Moderate
- Competition
- Moderate
- Time to hire
- Low
- Cost
- High
Grid fully constrained; pipeline 1.3x. 55 days (50). Construction wages up 27.4% against an EU 23.9%.
Frankfurt
- Availability
- Moderate
- Competition
- Severe
- Time to hire
- Severe
- Cost
- High
Pipeline 2.6x. 136 days (21). 68% hired locally (34), so imports offer little relief. 36.6% of German construction workers are 50 to 64.
Amsterdam
- Availability
- Moderate
- Competition
- Moderate
- Time to hire
- High
- Cost
- Moderate
Pipeline below live capacity. Construction vacancy rate 6.9%, the highest here. 26% hired locally (35). 75 days (19).
Paris
- Availability
- Moderate
- Competition
- High
- Time to hire
- High
- Cost
- Moderate
Pipeline 4.1x. Île-de-France construction workforce 387,700, up 8.8% since 2019. Wages up 13.1%, well under the EU.
Madrid
- Availability
- Low
- Competition
- High
- Time to hire
- Low
- Cost
- Low
Pipeline 4.3x. 88% hired locally (16). 64 days (22). Regional construction employment up 19% since 2019.
Milan
- Availability
- Low
- Competition
- High
- Time to hire
- High
- Cost
- Low
Pipeline 15x, with oversupply risk. 75% hired locally (8). 79 days (13). 41.2% of Italian construction workers are 50 to 64.
Helsinki and Finland
- Availability
- Severe
- Competition
- Severe
- Time to hire
- Moderate
- Cost
- High
Pipeline 18x. Construction workforce down 11.6% since 2019. 27% hired locally (44).
Nordic frontierNarvik, northern and central Sweden
- Availability
- Severe
- Competition
- High
- Time to hire
- Severe
- Cost
- High
11% hired locally in Norway (9), 29% in Sweden (24). 119 days for hires living in Norway (8).
Iberian frontierSines, Aragón
- Availability
- Severe
- Competition
- High
- Time to hire
- Moderate
- Cost
- Moderate
Sines could peak near the size of its sub-region's construction workforce. None of our 9 placements into Portugal lived there.
Brackets show the number of Clear placements behind a figure. Days shown are the median from first CV to first day for hires living in that country. Pipeline from Knight Frank; workforce, wages, vacancies and age from Eurostat and the ONS. A Severe market still gets built: the rating means the workforce plan is an import plan, with the cost, lead time and retention exposure that brings.

Geographic diversification does not diversify talent risk. A portfolio spread across Sines, Narvik and Helsinki draws on the same pool three times.
From the report, page 09
Tom co-founded Clear and has spent 15 years placing senior engineering, construction and facilities people in European Data Centers. If you are backing a platform or a site in one of these markets, he can tell you what the people plan looks like at role level, before the capital is committed.
The European Data Center Talent Risk Report 2026
16 pages. 1,896 of our own placements set against Eurostat and ONS data across 16 countries.
- Talent risk rated market by market, from London to Sines
- What the specialist layer now costs, and how long a hire takes
- Why a spread of European sites still draws on one workforce
- Leadership diligence for new platforms, and the case against our own report
Method
How this was built, and what it cannot tell you
The spine of the report is every placement on our own applicant tracking system from January 2021 to 1 October 2026: 1,896 after cancellations, of which 472 were paid in euros. For each we hold the role, the base salary, the date the first CV went to the client, the offer and start dates, and the candidate's home country.
Those records are set against Eurostat regional accounts, the EU Labour Force Survey, job vacancy statistics and the labour cost index for 16 countries, each against the EU27, with the ONS for the UK. Capacity and pipeline come from CBRE, JLL, Cushman & Wakefield, Knight Frank and DC Byte, and no figure combines two firms' numbers.
Limitations we would rather state than have you find
- Our book is not a random sample. Clear is headquartered in London, so UK and Irish candidates are over-represented, which inflates the cross-border share.
- The country of the role is inferred. We read it from the job record and could establish it for 289 of 472 euro-paid placements.
- Samples are small at country level. The count sits beside every figure, and nothing is charted on fewer than 8 placements.
- Salary movement includes mix. Our 2026 placements skew more senior than those of 2024, so the report shows discipline-level figures as well.
- The ratings are judgement.The market ratings and the leadership diligence pages are our consultants' view, informed by the evidence shown beside them.
Common questions
What is the European Data Center Talent Risk Report?
It is Clear's analysis of how hard it is to staff the design, build and commissioning of Data Centers across Europe, market by market. It sets 1,896 of our own placements, 472 of them paid in euros, against official statistics from Eurostat and the ONS for 16 countries.
Who is it written for?
Investors, lenders and the boards of developer-operators deciding where to commit capital and who to trust with it. It covers the people who select sites, design, build and commission a facility, and the leadership team above them. Live operations staffing is outside its scope.
Is there a construction labour shortage in Europe?
Not in the national statistics. The EU construction vacancy rate is 2.8%, below the 3.6% of 2019. The squeeze sits in a small specialist layer, commissioning leads, high-voltage authorised persons and project directors, that official data cannot see and our placement records can.
Which European markets carry the highest talent risk?
On our ratings, Helsinki and Finland, the Nordic frontier around Narvik and northern Sweden, and the Iberian frontier around Sines and Aragón. Frankfurt rates Severe for competition and time to hire. A Severe market still gets built; the rating means the workforce plan is an import plan, and belongs in the model from the day the site is shortlisted.
How long does it take to hire for a European Data Center project?
On our euro-paid placements, the median from first CV to offer was 49 days in 2026, up from 35 in 2025. Director-level hires took a median 103 days from first CV to first day, and hires living in Germany 136 days.
Does the report argue against itself?
Yes, on purpose. Page 13 sets out five arguments against our findings, starting with the one every broker makes: power, not people, is the binding constraint on European capacity. We agree. Our claim is about what happens after the grid connection is signed.
Backing a platform or a site in one of these markets?
We will tell you what the people plan looks like at role level, before the capital is committed.
Talk to our team